In 1998 (I can’t believe it was so long ago!) I was working at MATE (Media Access Technologies), an Israeli start-up at the time, specializing in face recognition and video searching. It was then that I came to know one of the coolest tricks in image recognition - the Hough Transform (pronounced “huf transform”).
In this article, I will demonstrate the algorithm with the following example:
Say you want to write a program that watches soccer. The input to your program is a sequence of frames from the game. The output should be the locations of all the players at all times. Given a frame of soccer, you first need to locate the players in the frame (i.e. you should know that a certain player occupies a certain set of pixels). Next, you need to know what location in the world is represented by those pixels. In order to do that, you need to figure out where the camera is positioned and where it is looking at. In this article I will focus on this part of the problem (understanding the view point and direction). I will not deal with the (easier) part of determining what pixels are occupied by players.
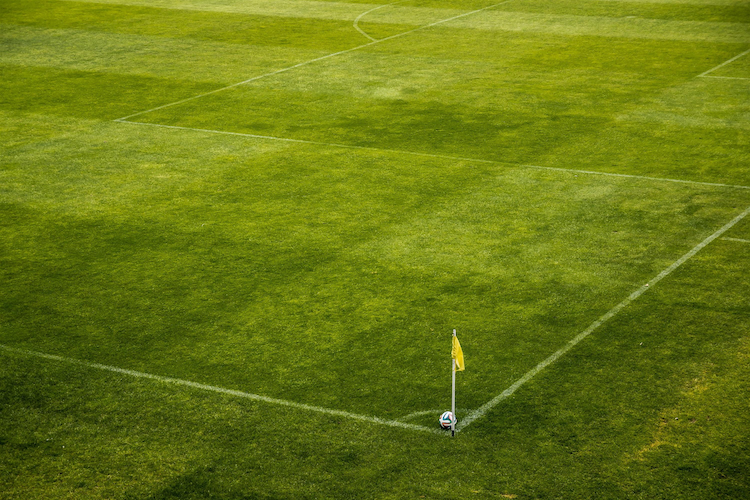
Consider the following image:
Applying a simple edge-detection algorithm that got me this:
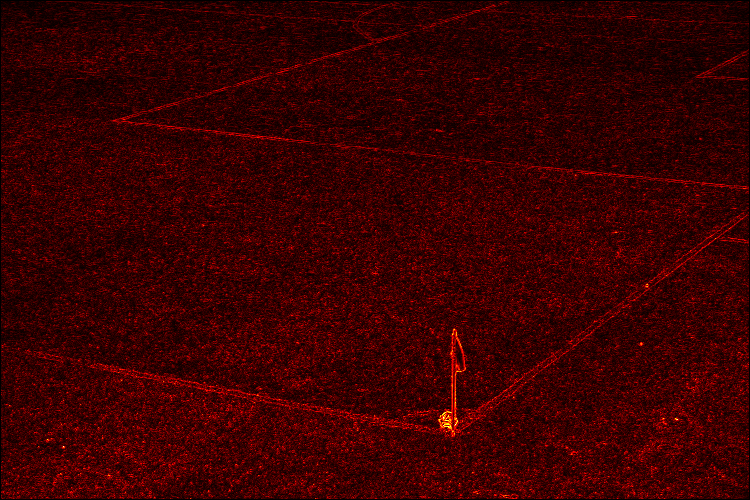
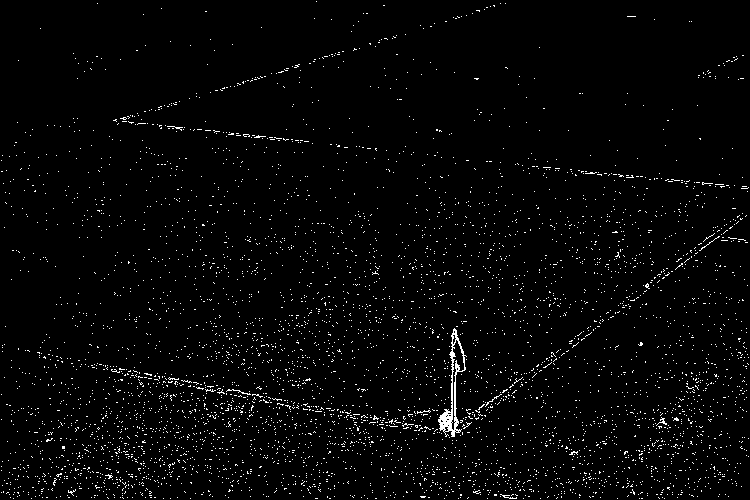
To get this image I converted each pixel to it’s luminance value, and calculated the sum of the absolute differences with its 4 neighbors (left, up-left, up, up-right). I then do another pass, and apply a threshold to the edges:
Let’s return to our original problem – determining the point and direction of view (POV). We have big clues in the picture for determining the POV, namely the lines on the ground. Can we somehow detect them?
Let’s formulate the following abstract problem:
You are given a matrix M over \(\mathbb{R}\) (i.e. a matrix of reals). The matrix represents an image. Pixel \(P_{i,j}\) of the image is white if \(M_{i,j}\) is 1 and black if \(M_{i,j}\) is 0. The image contains straight lines. The lines are not perfect (i.e. they may overlap, they may not be continuous and there is a lot of noise). Your goal is to develop an efficient algorithm that receives the matrix and outputs the line equations.
Please take some time to think about this before continuing to read. If you spend enough time thinking about it, you will probably reach the conclusion that this is a really though problem.
A solution to this problem is the Hough Transform. The Hough Transform consists of noticing an amazing duality of the Euclidean plane. We Consider the straight line equation:
\[y = mx + b\]In this equation m and b are constants and x and y are variables. But what happens if we make x and y constants and m and b variables?
Well, the set of m’s and b’s that satisfy the equation represents all the lines that pass through our point (x, y)!
It is easy to see that for each point in the x-y plane we get a line in the b-m plane, namely, the line:
\[b = -xm + y\]Now each line in the x-y plane is matched with a point in the b-m plane!
Note that there is an issue with using the b-m plane - Precision. For example, a near vertical line has huge values of m. In order to solve this, I used another duality (which is completely equivalent): the duality of the x-y plane and the \(r-\theta\) plane, where \(\theta\) is the angle of the line with the x axis (i.e. \(m = tan(\theta)\) ), and r is the distance of the line from the origin.
\[r = x \ cos(\theta) + y \ sin(\theta)\]So the algorithm basically says:
- Run through the original matrix.
- For each pixel (x,y) that is white draw the line that matches it in the dual plane.
- Then count the number of line intersections in the dual plane.
- All points at which there is an intersection of more than T lines (these correspond to lines in the x-y plane on which we have more than T points in our original image) are considered valid lines.
To better illustrate the algorithm, I jotted down a few lines of code. The results follow (I must say that I was really surprised that it worked perfectly the first time around! All the threshold values I picked were somehow correct on the first go ;-) ).
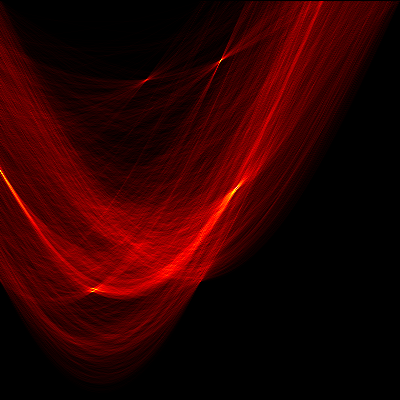
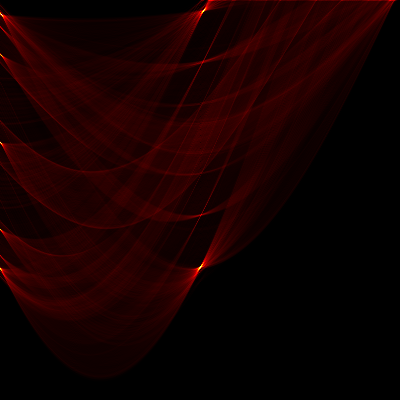
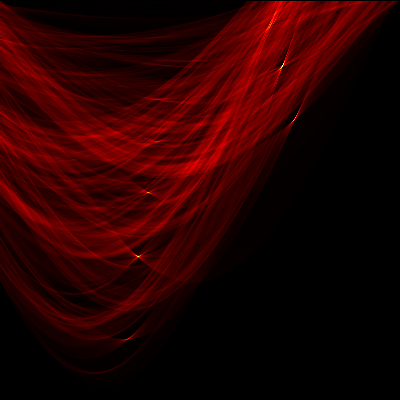
The Hough map (i.e. the result of the Hough Transform) my code produced is:
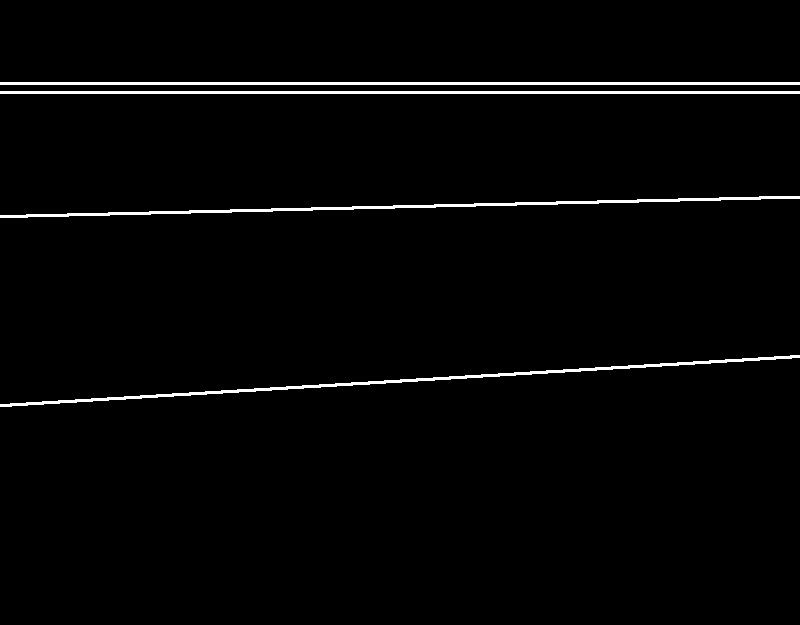
We then find local-maxima, apply a threshold and finally, the result (after converting back to the x-y plane):
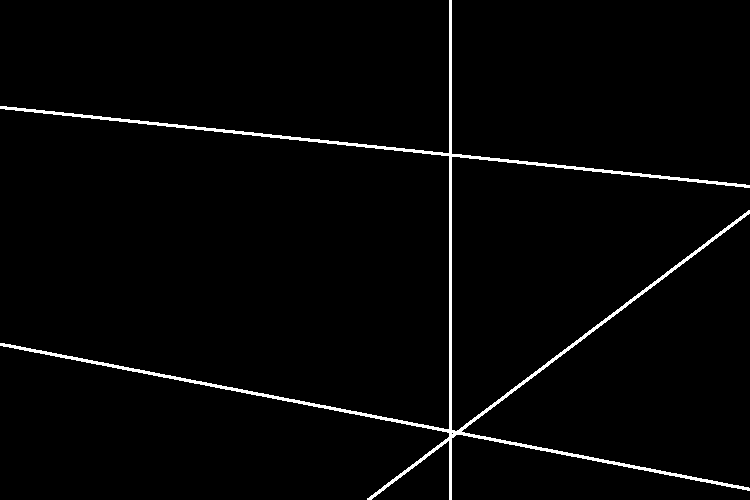
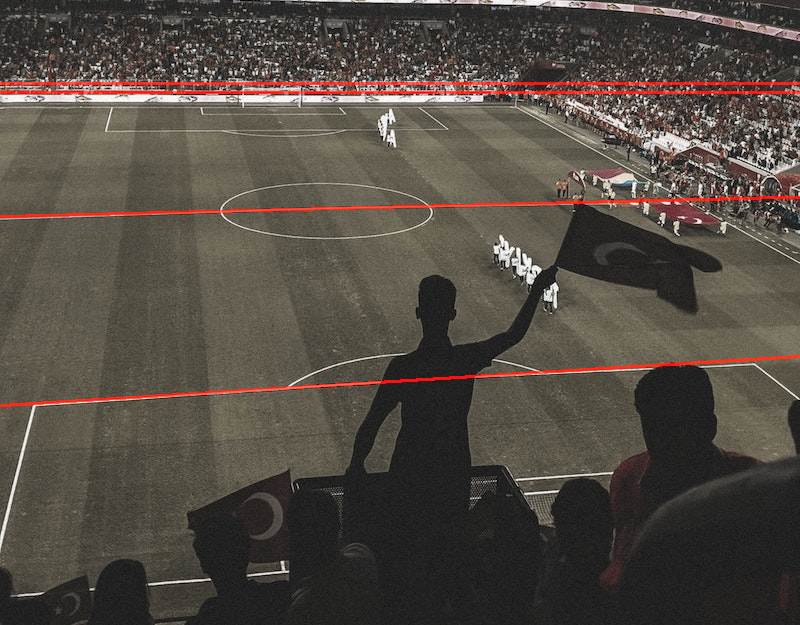
And the same result overlayed on the original image:
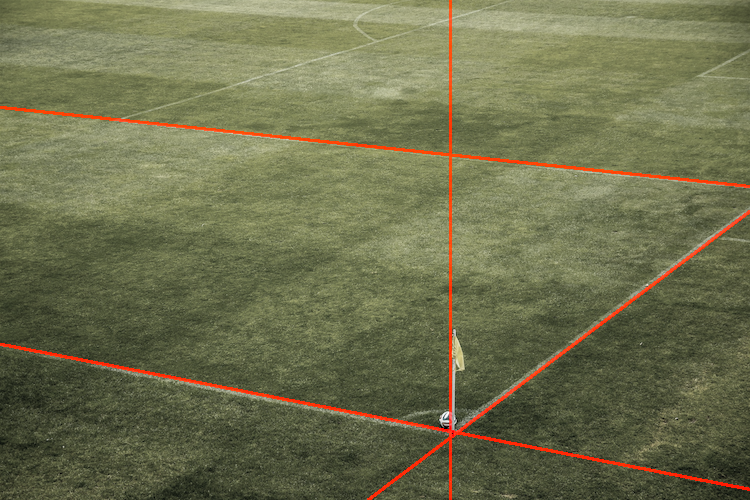
A great match! We do see that the flag pole also looks like a line :)
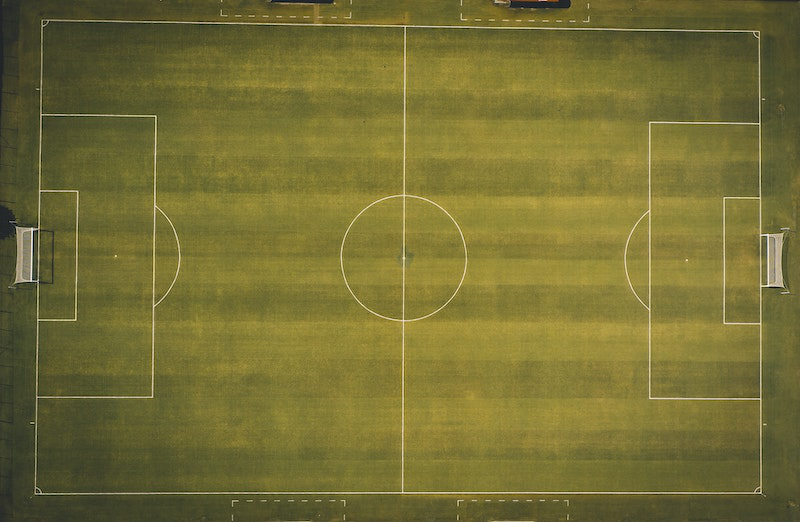
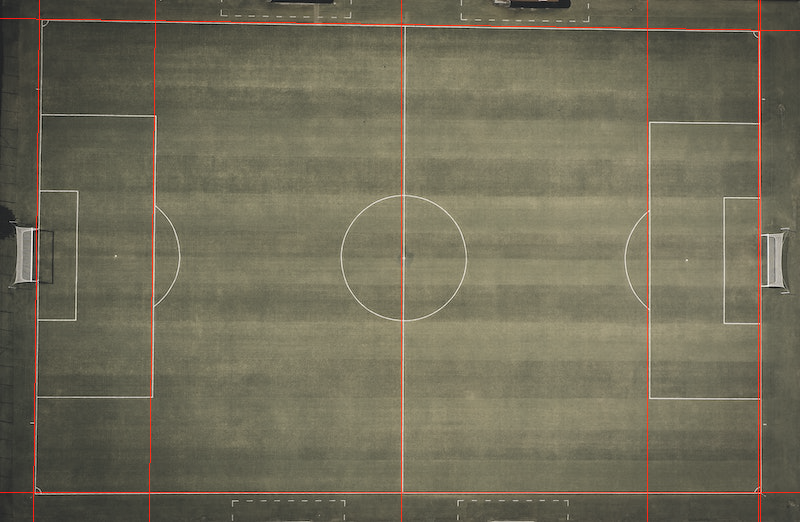
Here are some more results, this time, a top-down view:
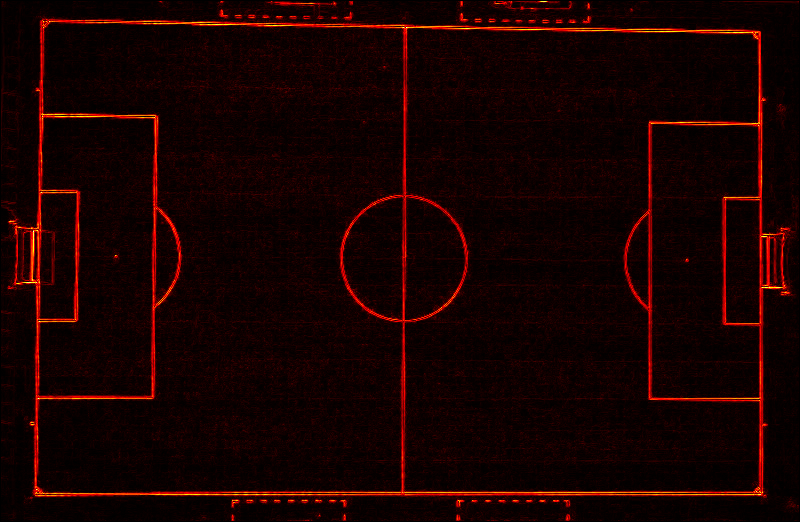
And the edges:
And the result of the Hough Transform:
And the reverse:
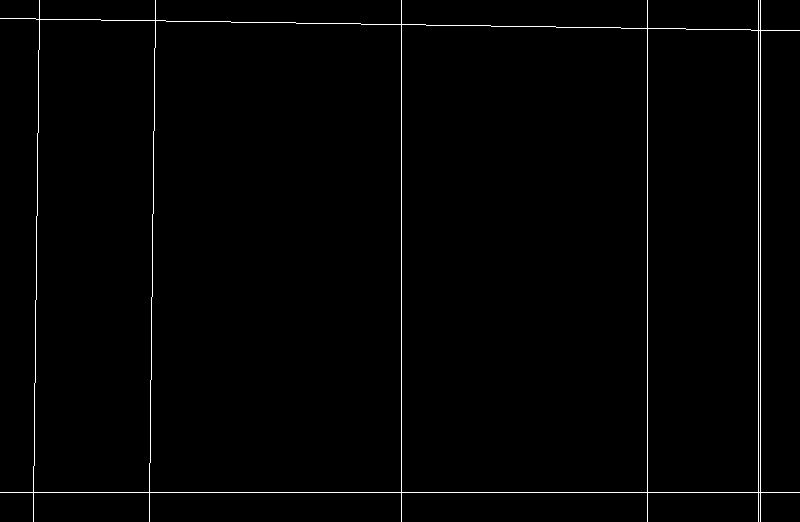
And overlayed on the original image:
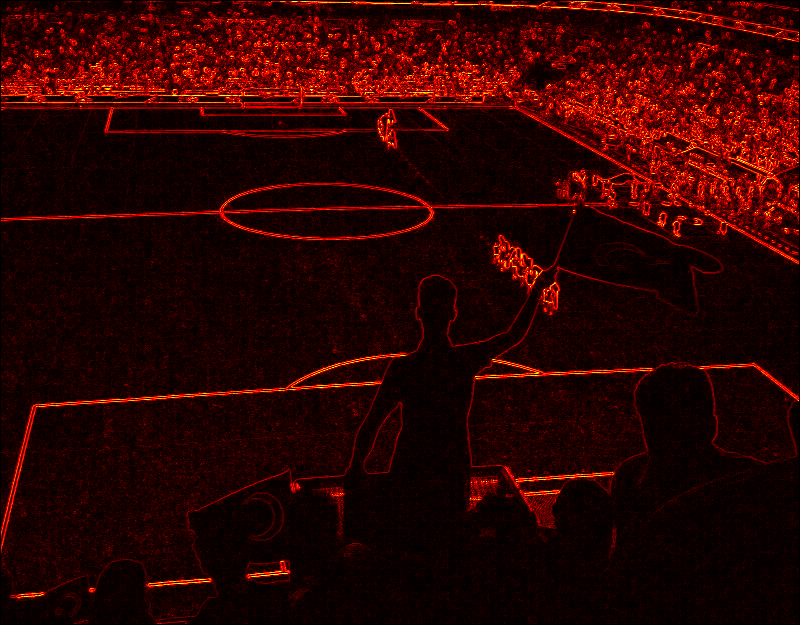
And a harder case with a crowd:

Edges:
Hough transform:

Reverse:
Overlay:
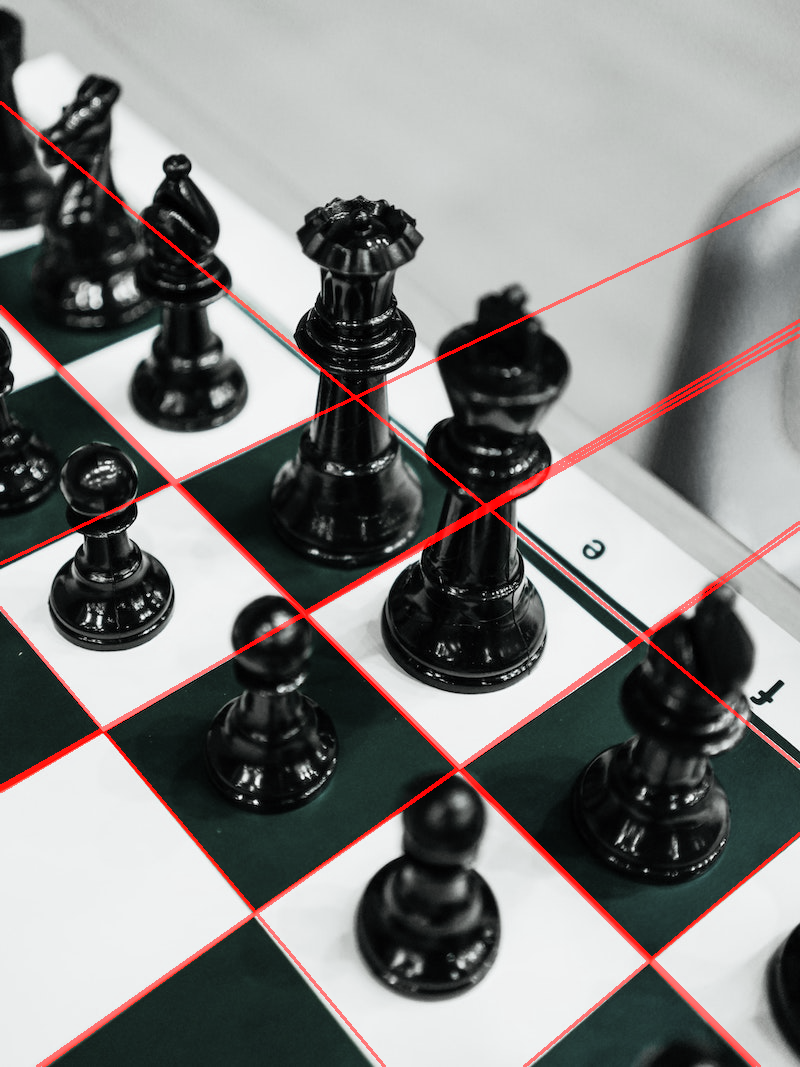
Finally, here’s a non-soccer example - a Chess board:

Edges:
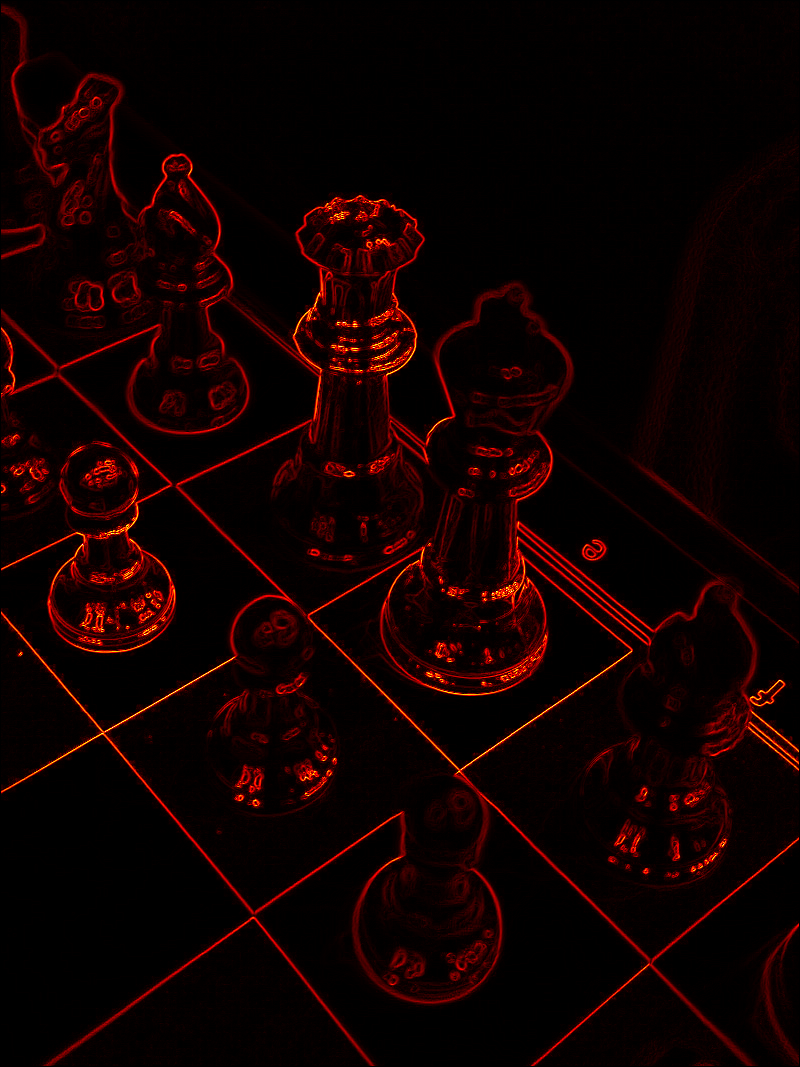
The Hough transform:
The reverse:
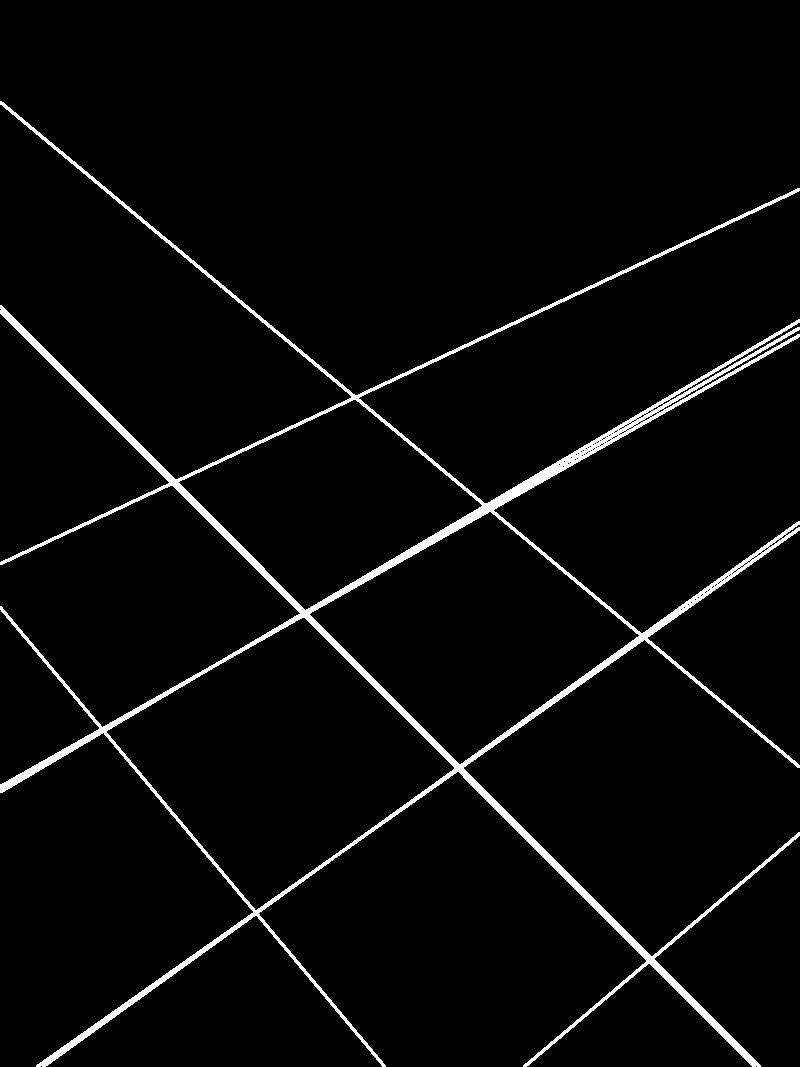
And overlayed on the original:
This is a big subject, and I only covered a small part of it. I will update this article in the near future with a more detailed analysis. If you have specific questions please post them as comments and I promise I will answer!
Meanwhile, let me just point out that the same method can be used to detect other shapes (e.g. circles). The generalization is trivial.
To be updated…